Wednesday, May 28, 2025

M2 - GIS Programming - Python Fundamentals

Screenshot of a script I created and ran using IDLE.

Week two of GIS Programming was a crash course introduction to the fundamentals of Python programming. It was a tremendous amount of information to absorb, and I see that I'll be referring back to this chapter of our textbook frequently for some time.

Module 2's lab student outcomes were:

Work with string variables in Python

Use and import modules

Save Python code as a script

Include comments in scripts

Create loops and conditional statements

Iterate variables within loops to control script workflow


We were tasked with working on a prewritten script as well as writing our own script using functions, methods, lists, loops, and more. I enjoyed this module, though I found it somewhat challenging. As mentioned, I'll be utilizing Chapter 4 in our textbook until I master the fundamentals.

The image above is a screenshot of a script I created and ran using IDLE. I found working in IDLE much easier than working directly in ArcGIS Pro Notebooks. However, I appreciate that in Notebooks, you can easily test individual lines of code.

Our script had to successfully perform two main functions. First, we needed to create a loop that adds 20 random numbers between zero and ten to a list, which we assigned to the variable luckyList. This involved initializing an empty list, setting up a counter variable, and using a while loop to append randomly generated numbers until the list reached twenty integers. An if statement was used to check when the count reached twenty, and a break statement was included to exit the loop. Finally, we printed the list after all numbers had been added.

The next part of the assignment required us to create a loop that removes a chosen integer from the previously generated list. We assigned this integer to a variable and used an if-else statement to check if it was present in the list. If the integer was not found, we printed a message indicating this; if it was present, we used the count() method to determine how many times it appeared and printed that information. We then employed a while loop to remove the integer from the list and printed the updated list afterward.

In my initial attempt at writing this code, I completed the expected tasks. However, upon review, I realized I hadn't followed the instructions precisely and had used a different method to achieve the same goal. This was actually exciting, as I was able to rely on my intuition to complete the task, even though it wasn't the instructed method. It perfectly illustrates the principle from “The Zen of Python” that there is often “one obvious way” or a “better” way to achieve a goal. However, I'm still uncertain which of the two approaches (my initial working version versus the assignment's requested method) would truly be considered the better way in terms of general programming practices.


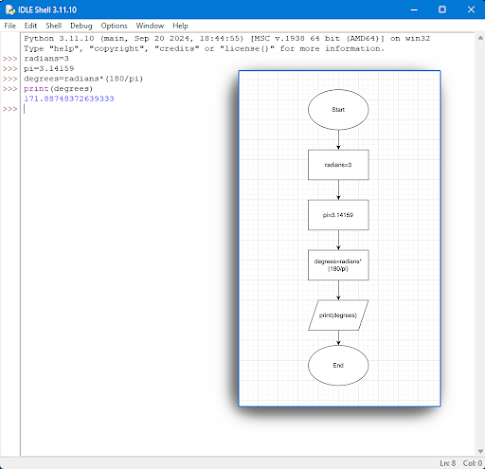
Below is the flow chart I created for this script. I'm anxiously looking forward to what's to come!




Monday, May 19, 2025

M1 - GIS Programming - Python Environments and Flow Charting


Welcome to GIS Programming, my third course in the GIS Certification Program at the University of West Florida! This is my first experience with Python, as well as my first taste of coding since I was about 15 years old. At that age, I bought a "C++ For Dummies" book and wanted to learn computer programming. I managed to code a CD music player for Windows 98, but that was the extent of my pursuit. I've always had an interest in coding, but I never learned anything beyond that.

As I worked through this first module, the excitement was reignited, and I can't wait to learn more.

Module 1 introduces us to Python and its various coding environments, from the basic Python Command Prompt to Integrated Development Environments (IDEs) such as IDLE and PyCharm. IDEs are applications that facilitate the writing, editing, and execution of code. They include features like syntax checking and debugging, which help users test their code in real time and fix any errors.

We were also introduced to Notebooks, specifically ArcGIS Notebooks. ArcGIS Notebooks are contained within ArcGIS Pro and have similar capabilities to an IDE (minus syntax checking and debugging). What Notebooks offer that IDEs do not is the ability to save your scripting file as a .ipynb file type, which allows for the inclusion of media such as images, hyperlinks, and HTML pages—capabilities that the .py file type does not allow.  Because ArcGIS Notebooks is part of the ArcGIS Pro software, it also allows real-time interaction with the current project data you're working with, helping improve workflow.

Flow charting is another aspect of programming we were introduced to. I must admit, I'm not always the best at planning and preparing for a project. I often jump right in, and because of that, I find myself running into issues I wasn't prepared for. I can see how creating a flow chart using pseudocode before writing your code is important and helpful.


We were also tasked with reading "The Zen of Python," a mantra authored by Tim Peters that can be accessed by typing "import this" at the command prompt, and sharing our interpretation.  


To me, “The Zen of Python” emphasizes that Python was created to be a more simple and intuitive way of programming and urges the user to remember this as they code.  It is saying “don’t overcomplicate when unnecessary, but find a balance in complexity.”  If a program you are writing is becoming chaotic, maybe there are other, better ways to write the script, and you should strive to be well-read and prepared for what you’re writing. It’s saying write cleanly, beautifully, and in a way that is not only easy for you to read, but also for others. In my opinion, it is a beautifully written set of philosophical guidelines to abide by when coding, and it makes me feel excited.

On to Module 2!

Sunday, May 18, 2025

My First Semester

Austin Jennings, May 2025, Boathouse Oyster Bar, Destin, Florida

I just finished my first semester of college, and I couldn't be more thrilled! While I don't have a full course load yet—unlike when I pursue my bachelor's degree—I'm still really proud of what I've accomplished so far.

I didn’t complete high school. My experience in school was quite challenging. The social environment at my original high school, Scottsboro High School in Scottsboro, Alabama, completely interfered with my ability to apply myself. I then transferred to Bob Jones High School in Madison, AL, a larger school in a more progressive area, and I enjoyed it. However, living with my uncle (who has since passed away) was not the best situation for me.

After that, I attended a private Christian academy, but it quickly became clear that the person running the "academy" was more interested in profit than in providing a proper education. Initially, I aimed for a career in journalism, and wanted to attend school at Vassar. I decided to drop out and get my GED when I was denied admission to Vassar because my current school wasn't accredited. 

Even though I scored very high on the GED test, I’ve always felt ashamed about not graduating from high school. I often have recurring dreams where I find myself back in high school, trying to finish my education as my current self (because dreams can be strange like that). This dream has made me realize how disappointed I was in myself.  While I have made a great career as a gigging solo musician, I still feel unaccomplished. 

Fast-forward to now: I just completed my first semester in the UWF GIS certification program, and I made the President's List!

Receiving the unexpected letter from Martha Saunders, the University of West Florida president, informing me that I made the President's Honor Roll for Spring 2025 filled me with excitement and pride like I’ve never experienced before.

I’m incredibly eager to continue my journey in higher education and start a new career in GIS and Data Science. I truly hope to keep up this momentum and maintain my 4.0 GPA throughout my college experience.

Onward and upward! 


Thursday, May 1, 2025

M7 - Computer Cartography - Google Earth Pro


Google Earth Pro Map of South Florida showing southern Florida counties, bodies of water, and population density. 


Wow! Module 7 marks our final assignment in the Computer Cartography course, completing my second course toward GIS certification.

This last assignment consists of two parts.

In the first part of Module 7, we learned how to take a feature layer in ArcGIS Pro—in this case, surface waters across South Florida—and convert and export it to a KML file for use in Google Earth Pro.

Once that task was complete, I opened the KML file in Google Earth and followed the steps to prepare the map shown above. I imported two additional feature layers (in KML format, provided by our professor): one for South Florida counties and the other a dot map illustrating population density. We learned how to adjust the drawing order of our layers by modifying their altitude for optimal visibility. Additionally, we added our legend (in image format provided in our lab data) by creating an image overlay.

The second part of Module 7 involved creating a Google Earth Tour, flying over the Florida landscape to highlight areas of interest. Using Placemarks, we established "tour stops," starting with our prepared South Florida map and then moving on to the Miami metropolitan area, Downtown Miami, Downtown Fort Lauderdale, the Tampa Bay area, St. Petersburg, Downtown Tampa, and finally returning to our original map view of South Florida.

During the tour, we were able to zoom in and explore different areas, observing how some buildings featured 3D renderings, while others in Tampa showcased accurate photorealistic representations based on LIDAR data.

I chose to highlight a few special points of interest along the way, including the Freedom Tower at Miami Dade College, the Salvador DalĂ­ Museum, and the Tampa Post Card Mural.

This entire course has been incredibly fun and engaging. I'm very proud of the deliverables I've submitted for each assignment, and I hope my work translates well in this blog, contributing to a solid portfolio.

Now, onto the next course: GIS Programming!


(When I have a few extra minutes, I will upload my tour file so I can share it with you to interact with in Google Earth!)

M5 - GIS Programming - Explore and Manipulate Data using Python

This week allowed us to dive deeper into ArcPy and explore data manipulation within ArcGIS Pro. We focused on using Python scripts to intera...